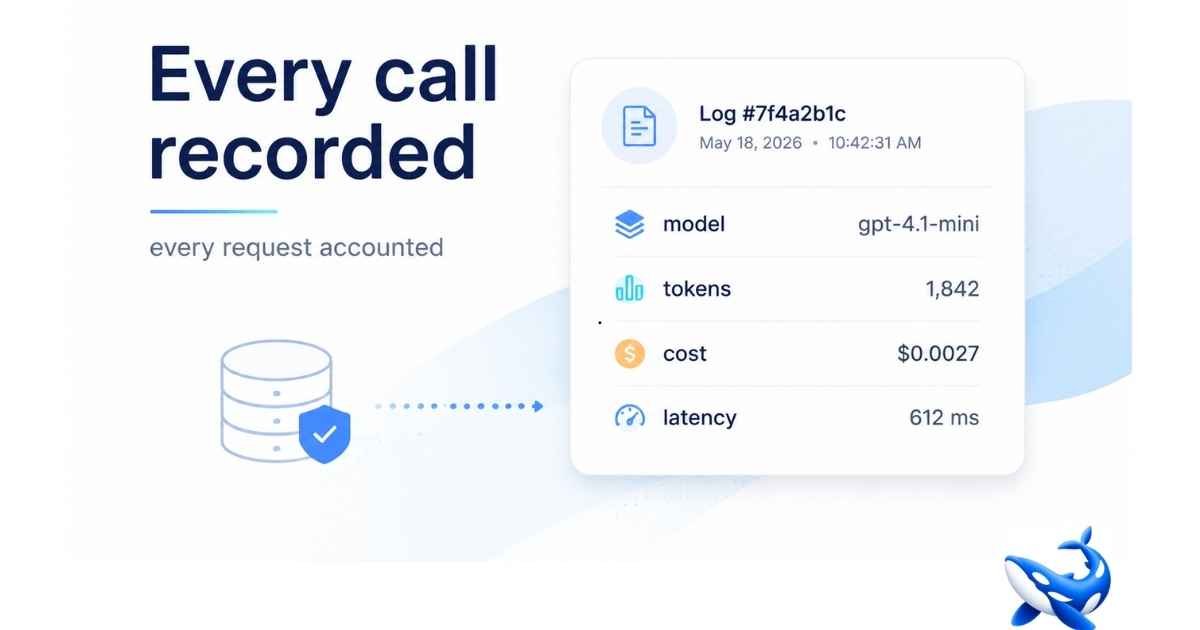
The per-call record an LLM router keeps is the observability story for model spend, because the router is the chokepoint every request passes through. OrcaRouter is one platform built around this pattern.
What the record contains
Every request records which model answered, the tokens used, the cost at list price, and the latency. That single record answers the questions teams ask constantly: what did we spend on Claude versus GPT, which model is actually fastest for this task type, where is the slow tail, which team is burning the budget.
Why it beats bolting on observability
Instrumenting model calls from inside your application is a per-codebase project, and it misses what you do not instrument. The router sees everything by construction, so the record is complete, consistent and free of per-team gaps. It is not a dashboard nicety; it is the feedback loop that keeps routing rules honest.
From record to decisions
The data converts into three decisions: which models stay in the pool, which rules tighten, which teams get budgets. A model that never earns a request is dropped; a task type that clears on a cheap model gets a cheap-first rule; a rising team spend gets a cap before it is a surprise. The router records because it is the chokepoint, and the reports are slices of the same data.
From logs to decisions, fast
The value of the record is only realised when it becomes decisions quickly. A router that tells you on Monday that a model has drifted in latency or cost lets you adjust the pool on Tuesday, before the problem compounds. Teams without the record discover the drift when the invoice or the p99 alert arrives. The difference between reacting to model problems and seeing them forming is exactly the per-call record. That is why observability is not a dashboard feature; it is the feedback that keeps the routing rules honest and the pool current.
The three reports that matter
The per-call record converts into three regular reports, and each one drives a decision. The cost report shows which model is earning its place and which workload is over-provisioned — it drives pool hygiene and rule tightening. The latency report shows where the p95 tail lives and which provider is degrading — it drives routing changes before the complaints arrive. The failure report shows which providers are flaky and which rules mis-fire — it drives failover order and rule fixes. All three are filters over the same log, and all three are what turn the router from a cost tool into a decision tool. Teams that run the three reports regularly are the ones whose routing rules stay honest and whose pool stays current.
The dashboard that matters
The observability value of a router is best experienced as a single dashboard: cost per task type per model, latency p95 per model, failure rate per provider. That one view answers the questions that decide whether the routing rules are working. Is the cheap-first rule actually sending tolerant work to the cheap model, or is everything still hitting the frontier model because the rule never fired? Is the latency tail on one provider growing, and should the rule route around it? Is a model that was added to the pool earning its place, or should it be demoted? The dashboard is a filter over the per-call record, and it is what turns the router from a cost tool into a decision tool. Teams that check it weekly keep their rules honest; teams that never look let the pool drift.
The weekly habit
The observability value compounds with a simple habit: check the routing dashboard weekly for the first month, then monthly. Look at which models earned traffic, which rules fired, where the cost and latency tails are. Each look is a chance to tighten a rule or demote a model, and because changes are configuration, the cost of trying something is an afternoon. The habit is what keeps the routing rules honest and the pool current, and it is the difference between a router that improves and one that drifts.
The quiet payoff
The quiet payoff of observability is that it stops being a separate activity. The record the router keeps for cost and failover is the same record that answers the debugging question, the budgeting question and the model-selection question. One log, many uses. Teams that build this in from the start never run a separate observability project; the data is just there, and the reports are slices of it. That is the definition of infrastructure that pays for itself — it is used every day for decisions, not just inspected during an incident.
The takeaway
Observability for LLMs is “every call, every token, every dollar”, and an LLM router provides it by being the layer every request passes through. Model, tokens, cost and latency are recorded per request, giving you the reports and the feedback you need without building an observability pipeline. That single view is worth the routing layer by itself.
Sourcing note: this article describes the LLM-router category and OrcaRouter’s implementation. Routing, failover, cost and latency claims are OrcaRouter’s own published descriptions, checked August 2026.
Disclaimer: The information provided in this article is for general informational and educational purposes only. It does not constitute professional technical, financial, or business advice. Routing, cost, and latency figures are based on published descriptions checked at the time of writing and may change. Readers should independently verify any platform claims and assess suitability for their own infrastructure. The mention of OrcaRouter or any specific product is illustrative and does not imply endorsement. The author and publisher disclaim all liability for any decisions, cost outcomes, or operational issues arising from reliance on this content. Always test and monitor systems within your own environment. This article does not guarantee specific performance or savings.
Ready to break through your barriers? Our barrier-breaking strategies help you overcome every obstacle.