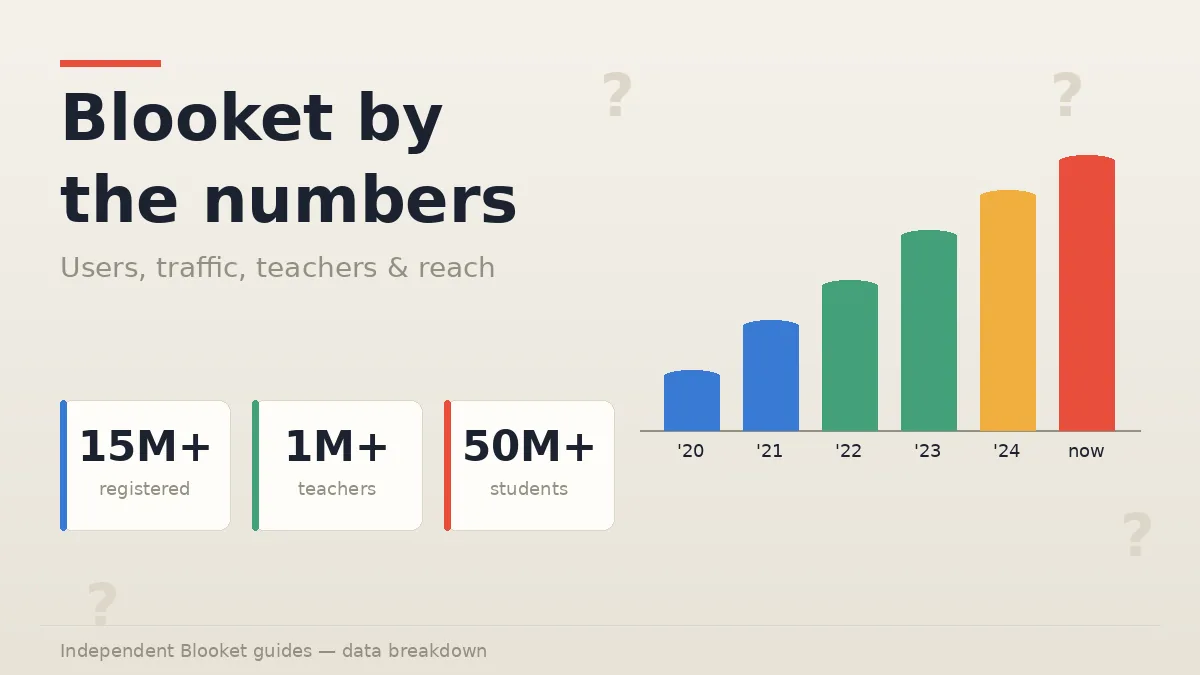
Blooket has grown from a solo high-school project into one of the biggest classroom gaming platforms on the internet. The short answer to how many people play Blooket: tens of millions. Reported figures point to over 15 million registered users, more than one million teachers globally, and 50-plus million students who have joined at least one game. Monthly visits to the platform swing between roughly 20 and 60 million depending on where the school year sits. This guide walks through every credible number, where each one comes from, how Blooket stacks up against Kahoot and Wayground, and what the growth story really means for teachers and students choosing a review platform.
How many people play Blooket right now?
Blooket reports over 15 million registered users, roughly one million active teachers, and 50-plus million students who have joined at least one game. Monthly active users sit in the 5 to 10 million range, and monthly website traffic ranges from 20 million during quiet summer months to over 60 million during peak testing season.
Not every “user” count means the same thing. Some published numbers include only teacher accounts, others count every student who ever tapped a game code. That is why you will see figures across the web that look wildly inconsistent, from “5 million users” to “50 million students.” Both can be true. They are just measuring different things.
The most stable way to think about it is in three layers. Registered accounts (teachers plus students who signed up) sit above 15 million. Students who have joined at least one live game (with or without an account) sit above 50 million, because a large share of players enter through a temporary game code without ever creating a profile. And monthly active users, the number that matters most for real-world engagement, sits between 5 and 10 million depending on the calendar.
Registered users vs monthly active users
Registered users is a cumulative number that only grows. Once a teacher signs up, they stay in the count even if they stop hosting. Monthly active users (MAU) is a moving target. It drops in June and July when schools close, spikes again in September, and peaks in April and May during review-heavy testing season.
For a platform where the entire growth model is teacher-driven, the ratio of registered to active tells you the retention story. Blooket’s roughly 5-10 million MAU against 15 million registered accounts is a solid retention rate for any free-first education tool.
Where did all that growth come from?
Blooket launched publicly in October 2020, right as US schools scrambled for remote-learning tools. The timing pushed daily sign-ups from a few hundred to tens of thousands almost overnight, and monthly traffic multiplied roughly ten times between October and November of that year. The core team stayed small, the platform stayed bootstrapped, and word-of-mouth from teachers carried the rest.
When I dug into archived traffic data, a clear pattern showed up. Blooket did not have a viral marketing moment or a paid growth engine. It had a small, well-timed product that solved a specific classroom problem, and one teacher told another teacher told a whole department. If you want more on how the platform started, the full history of Blooket covers the founding story in detail, and the ownership guide walks through who runs it today.
The growth curve since 2020 has been steady rather than viral. From roughly 5 million users during the pandemic peak, Blooket climbed to about 10 million by 2023 and past 15 million by 2024. Traffic has continued to grow year over year in the 15-25 percent range, which is unusual for an EdTech platform that already sits in the top 500 global sites.
Monthly traffic: what the data actually shows
Blooket sits comfortably in the top 500 global websites and ranks near the top 30 education sites in the United States. Total monthly visits swing between around 20 million during quieter summer months and over 60 million during peak testing season, according to public analytics from SEMrush and Similarweb.
Total visits and platform rankings
The most recent public traffic snapshots from Similarweb show blooket.com pulling in roughly 62 million visits across a three-month spring window, with a global rank hovering around the top 400 to 500 sites worldwide and inside the top 30 education sites in the United States. SEMrush data from the same period shows roughly 30 million visits in a single month, with the number climbing in each of the previous quarters.
Two things worth flagging. First, these are estimated figures from third-party analytics firms, not official metrics from Blooket itself. Second, they only count visits to the main blooket.com domain. Actual gameplay happens on subdomains like play.blooket.com and id.blooket.com, and those add tens of millions of additional visits that are usually counted separately.
If you add every Blooket-owned subdomain together, the platform sits in the traffic tier of major EdTech names like IXL and Kahoot, which is remarkable for a company that never raised venture money and never ran meaningful paid ads.
Engagement metrics that outperform peer platforms
The traffic story is impressive, but the engagement metrics are where Blooket really pulls away.
Recent public data shows an average visit duration of around 8 to 13 minutes, pages per visit near 10, and a bounce rate between 15 and 18 percent. For any education site, those are strong numbers. For most, they would be borderline unbelievable.
Here is why they matter. A bounce rate under 20 percent means fewer than one in five visitors leaves immediately. Ten pages per visit means most people are actively navigating, not just landing and leaving. And an 8-plus minute session length is unusually long for a review tool. Compare that to a typical quiz-app session of 3 to 5 minutes and you can see why teachers keep coming back.
Traffic sources tell their own story. Direct visits (people typing “blooket.com” straight into the browser) make up roughly 65-70 percent of all incoming traffic. That is a strong brand-recognition signal. Google organic search covers another 20 percent, and the rest comes from referrals, email, and social. Very little of it is paid.
Which countries play Blooket the most?
The United States sends the largest share of Blooket traffic at roughly 35 to 40 percent, followed by Australia, Canada, the United Kingdom, and Thailand. Combined, the top five countries account for around 70 percent of global usage, with the platform reaching classrooms in over 150 countries in total.
Here is how the top-five traffic share breaks down in a typical month:
| Country | Approximate traffic share | Estimated monthly visits |
|---|---|---|
| United States | 35 to 40 percent | 12 to 25 million |
| Australia | 10 to 12 percent | 3 to 6 million |
| Canada | 9 to 10 percent | 2.5 to 5 million |
| United Kingdom | 8 to 9 percent | 2 to 4.5 million |
| Thailand | 4 to 5 percent | 1 to 2.5 million |
A few things stand out. The US dominance is expected, given that Blooket is a US-founded platform. But Australia and Canada punch far above their population size. Both countries have small student bases relative to the US, yet they contribute nearly a quarter of Blooket’s total traffic between them. That signals unusually deep teacher adoption in those markets.
Thailand cracking the top five is the more surprising story. It shows Blooket is not just an English-speaking product anymore. Teachers in Asia and Latin America are building question sets in local languages and running games with mixed-language classrooms. The platform’s low barrier to entry (no student accounts required, just a code to join a game) makes it easy to adopt in any language.
How Blooket stacks up against Kahoot, Wayground, and Gimkit
In direct traffic comparisons, Blooket has caught up with, and in some recent months exceeded, Kahoot on total monthly visits. Wayground (rebranded from Quizizz) still leads on total monthly active users. Gimkit trails both on raw scale but keeps a devoted following among older students who prefer its faster, economy-driven style.
Here is a snapshot comparison using recently published public figures:
| Platform | Approximate reach | Positioning | Paid entry price |
|---|---|---|---|
| Blooket | 15M+ users, 5-10M MAU | Gamified review with collectible Blooks | Around $5/month (annual) |
| Kahoot | 10B+ lifetime participants | Buzzer-style quiz king, enterprise focus | Around $4/month (annual) |
| Wayground (Quizizz) | 75M+ MAU across 150 countries | Full assessment system with AI features | Around $8/month |
| Gimkit | Smaller but loyal audience | Economy-driven, high-schooler favourite | Around $10/month |
Blooket vs Kahoot
Kahoot has been around since 2013 and still holds the largest lifetime reach in the category. But its traffic has been flat or slightly declining over the past two years, while Blooket has grown roughly 20 percent year over year. In several recent months, Blooket’s total monthly visits actually crossed Kahoot’s for the first time.
The engagement gap is even wider. Where Kahoot averages roughly 5 minutes per session, Blooket sits closer to 10-13 minutes. The difference is the collectible Blook economy. Kahoot ends when the quiz ends. Blooket keeps students coming back to grind for tokens and collect rare Blooks.
Blooket vs Wayground (formerly Quizizz)
Wayground is still the biggest player in the space by monthly active users, with reported figures north of 75 million. It also has full assessment features, formal reporting, and enterprise pricing that Blooket doesn’t try to match.
But Wayground and Blooket serve different niches. Wayground is a testing and homework platform first, with quiz-game modes as a secondary layer. Blooket flipped that. Games first, quizzes second. For teachers who want engagement over analytics, Blooket wins on retention. For teachers who need gradebook integration and formal proctoring, Wayground is the better fit.
Blooket vs Gimkit
Gimkit is the smallest of the three, but it holds one specific corner well: older students. Middle-schoolers and high-schoolers who find Kahoot too basic and Blooket too colourful often gravitate to Gimkit’s economy-heavy style. Its total user base is a fraction of Blooket’s, but its per-session engagement is comparable.
For a full breakdown of every mode Blooket ships with and how they compare to competitor formats, the game modes guide walks through each one with real classroom pacing notes.
Teacher adoption and the Plus subscriber story
Over one million teachers worldwide use Blooket. The vast majority stay on the free plan, which covers the core features most classrooms actually need. A smaller but meaningful share upgrades to Blooket Plus, priced at roughly $5 per month when billed annually, or Plus Flex at about $10 per month on a rolling monthly basis. Schools and districts can also purchase a Group plan that starts around $550 per year for a small team of teachers.
What the free plan covers
The free tier is unusually generous for an EdTech platform. Teachers can build unlimited question sets, host a game for up to 60 students at a time, use most game modes, and access basic reports. Students never need to create an account. They just enter a game code and start playing.
For a teacher running one or two review sessions a week with a standard class size, the free plan is enough. That is why the vast majority of registered teachers never upgrade, and Blooket is fine with that. The freemium model works because free teachers still bring in students, and students still generate traffic and word-of-mouth.
What Plus and Plus Flex add
Blooket Plus, at roughly $5 per month billed annually, adds the features that heavier users notice most. That includes higher player caps (up to 300 in a live game, useful for assemblies and district-wide events), exclusive game modes, folders for organizing question sets, priority customer support, detailed question-by-question reporting, and audio-question support.
Plus Flex offers the same features on a monthly-only billing cycle at roughly twice the annual per-month price. It exists for teachers who only need Plus during specific periods of the school year and want to cancel between them.
The Group plan, for schools and districts, starts around $550 per year for a small team of teachers and scales up based on seat count. It bundles Plus features with centralized billing and management. Most teachers never see this tier because it is handled directly by school administrators.
How many teachers actually upgrade?
Exact conversion figures are not public. But based on the size of the free base and the pricing signals Blooket sends, the paid-to-free ratio is low. In my own conversations with teachers who have used the platform for multiple school years, only about one in ten had upgraded to Plus at some point. Most stayed free.
That is not a weakness. It is the model. Blooket does not need every teacher to convert. It needs enough teachers to convert to fund the free tier, and the numbers suggest that ratio is working.
What the numbers say about Blooket’s staying power
Retention metrics are the strongest signal that Blooket is more than a passing classroom trend. Average session length runs between 8 and 13 minutes, pages per visit sit near 10, and bounce rates hover in the 15 to 18 percent range. Numbers like these are unusual for any education site and suggest the collectible mechanics keep students coming back long after the class-time review ends.
A few things reinforce this. First, the platform’s traffic pattern maps almost perfectly onto the US school calendar, with clear drops in June-August and December, and equally clear spikes in September, October, April, and May. That kind of pattern only shows up when actual classrooms are using a tool, not when it is being driven by casual browsers.
Second, the direct-traffic share (people typing “blooket.com” straight in) is unusually high at 65 to 70 percent. That is a brand-loyalty signal you rarely see outside of top-tier consumer sites.
Third, competitive pressure has not slowed the growth. Wayground, Gimkit, and a handful of newer platforms have launched aggressive teacher-marketing pushes in the past two years. Blooket has kept its share, and in several months, taken share back.
If you are a teacher wondering whether the platform is worth investing time into, the durability numbers say yes. If you are a parent trying to understand what your child is playing, the safety guide covers the privacy and moderation angles in detail.
FAQs
How many total Blooket users are there globally?
Blooket reports over 15 million registered users worldwide, with 50-plus million students who have joined at least one game. Monthly active users sit between 5 and 10 million depending on the school calendar. Total lifetime reach is significantly higher because most students play through a temporary code without ever creating an account.
How many teachers actively use Blooket?
Over one million teachers globally use Blooket, according to public platform metrics. That figure grew rapidly during the pandemic and has continued climbing at a slower but steady pace since. Roughly 90 percent of active teachers stay on the free tier, with the remaining share upgrading to Plus, Plus Flex, or a school-level Group plan.
How many daily active users does Blooket have?
Blooket does not publish official daily active user counts, but with monthly visits ranging from 20 to 60 million, daily traffic likely falls between 700,000 and 2 million visits during peak school-year weekdays. Actual gameplay sessions per day are higher because a single visit often includes multiple hosted games.
Is Blooket more popular than Kahoot?
In several recent months, Blooket has crossed Kahoot in total monthly website visits for the first time in the platform’s history. Kahoot still leads on cumulative lifetime participants (over 10 billion) and enterprise adoption, but Blooket now leads on session length, retention, and year-over-year growth in the K-12 classroom segment.
How much does Blooket Plus cost?
Blooket Plus costs roughly $5 per month when billed annually, and Plus Flex costs about $10 per month on a rolling monthly basis. Schools and districts can purchase Group plans starting around $550 per year for a small team of teachers, with pricing scaling upward based on seat count. Pricing may vary and should be verified on the official Blooket site.
How many countries have Blooket users?
Blooket is used in over 150 countries. The largest user bases are in the United States, Australia, Canada, the United Kingdom, and Thailand, which together account for around 70 percent of global traffic. Adoption in non-English-speaking markets has grown steadily as teachers build question sets in local languages.
Has Blooket’s user base grown or plateaued?
Blooket has grown steadily rather than exploded. From roughly 5 million users during the pandemic peak, the platform climbed to over 15 million registered users, with year-over-year traffic growth in the 15 to 25 percent range. Growth is slower than the 2020-2021 boom but faster than most mature EdTech competitors.
How many game sessions happen on Blooket each day?
Exact daily session counts are not published, but with monthly visits between 20 and 60 million and an average visit that includes multiple game rounds, the platform likely facilitates several million individual game sessions per day during the school year. That number drops significantly during summer break and rebounds in September.
Final thoughts
The scale of Blooket is easy to underestimate until you sit with the numbers. Fifteen million registered users, over a million teachers, 50-plus million students, and monthly traffic that regularly cracks the top 500 global sites. This is not a niche classroom tool anymore. It is a fixture. The bootstrapped growth story, the engagement metrics that outperform every peer platform, and the retention pattern that maps cleanly onto real school calendars all point to a product that has quietly become a staple.
If you teach and haven’t tried it yet, worth a look. If you already use it, the data confirms what you probably already suspected: your students are part of a very big number. For more on how the platform actually works day to day, browse through the wider set of guides on blooket.it.com or start with the what is Blooket overview.
See the world differently — explore unusual angles on trending topics.