A DevTool creator campaign can produce 80,000 views, a wave of comments, and a bump in branded search, and still be a bad investment. The failure rarely shows up in the numbers marketing reports first. It shows up two steps later, when nobody on the team can say how many of those 80,000 viewers ever generated an API key. Reach and engagement describe exposure. They say nothing about whether a developer opened the docs, got through the quickstart, and wrote a line of code that called the product. For a DevTool, that gap is the whole game. This piece lays out a funnel and a set of formulas for closing it: how to track a creator from the moment someone watches their video to the moment a developer makes a first API call, what each stage should cost, and how to tell a campaign that looks good from one that is good.
Why influencer marketing ROI looks different for a DevTool
Consumer and most B2B influencer campaigns treat a sale as the step right after a click. Someone watches, clicks, buys. For an API, SDK, or infrastructure product, a sale is rarely that close. Between the video and the invoice sits a technical evaluation: reading documentation, creating an account, generating a credential, writing integration code, and running that code against a live endpoint. Every one of those steps is a decision made by an engineer who assumes marketing claims are exaggerated until the product proves otherwise.
That changes what qualified means. A consumer campaign can call a click qualified once it lands on a product page. A DevTool campaign can’t, because a developer can land on that page, skim two paragraphs of the pitch, and leave without ever opening the docs. The event that actually confirms interest sits further down the funnel than most influencer reporting tools are built to measure, which is why so many DevTool teams end up reporting on views and clicks anyway. It’s not that they don’t know those numbers are weak. It’s that nobody wired up the tracking to report anything better.
Define ROI for a DevTool campaign as the relationship between what you spent and the developers who reached product value, not just the developers who reached your website. Revenue is still the final scoreboard. But revenue alone is a lagging number for a product with a multi-week evaluation cycle, which is why the rest of this piece builds out leading indicators, first API call, activated developer, qualified signup, that tell you whether a campaign is working while there’s still time to act on it.
The DevTool influencer funnel, from video view to paid customer
The funnel for a DevTool creator campaign has more stages than a typical consumer funnel, because the evaluation happens inside the product, not on a landing page:
- Video view
- Engagement (likes, comments, shares)
- Link click
- Landing page or product page visit
- Documentation visit
- Signup
- Installation or SDK download
- API key creation
- First API call
- Repeated usage (second, third, tenth call)
- Activation (the point where a developer is getting real value, defined below)
- Retention (still calling the API in week 4, month 2)
- Paid conversion
Stages 1 to 4 are standard marketing funnel territory. Stages 5 through 13 are where a DevTool campaign is actually won or lost, and where most influencer reporting stops looking. A campaign that never gets reported past stage 4 will always look like a top of funnel exercise, because that’s the only part anyone measured.
What to track at each stage
Not every stage needs its own dashboard tile, but each one needs a defined event and an owner. Group the thirteen stages into four phases:
| Phase | Stages | What to track | What good looks like | What to ignore |
|---|---|---|---|---|
| Reach | Video view, engagement | Views, watch time, comments, shares | A comment section with specific technical questions, not just reactions | Raw view count treated as a success metric on its own |
| Qualified traffic | Click, landing page visit, docs visit | Click-through rate, docs-visit rate from the landing page | A high share of clickers reaching the docs, not just the homepage | Click-through rate compared across creators with very different audience sizes |
| Technical evaluation | Signup, install, API key, first API call | Signup rate from docs, install-to-key rate, key-to-first-call rate | Most people who create a key also make a call within days | Signups with no product event attached to them |
| Product outcome | Repeated usage, activation, retention, paid | Calls per week, activation rate, week-4 retention, conversion to paid | Activated developers still active at 30 and 60 days | Treating activation as the finish line instead of a milestone toward revenue |
The columns that matter most for a board or CFO conversation are the last two: technical evaluation and product outcome. That is where creator campaigns are won or lost, and where the rest of this piece spends its time.
Building creator-level attribution that survives a pipeline review
None of the funnel above means anything if you can’t say which creator produced which developer. Attribution for a DevTool campaign has three jobs: give every creator a unique trail, carry that trail from the browser into the product, and account for the traffic that loses its trail along the way.
Give every creator their own trackable path
Assign each creator a unique UTM combination, source, medium, and a creator-specific campaign value, for every link they publish, and don’t reuse a link across platforms for the same creator. A YouTube video and a companion LinkedIn post from the same person need two different UTM sets, because their audiences and conversion rates will differ even when the creator is the same. Where the platform supports it, pair the UTM with a promo code or a referral parameter the developer can carry into a CLI command or a signup form, since a meaningful share of developers will copy a link into a new tab, lose the query string, and arrive at signup with a bare URL.
Connect creator traffic to product analytics
A UTM parameter dies at the landing page unless something carries it forward. Capture the UTM and referral data at first touch, store it on the session, and write it into the user record at the moment of signup, not just into a marketing tool that only sees the website. From there, forward the creator attribution as a user property into whatever product analytics platform runs your event tracking, Amplitude, PostHog, Mixpanel, or an in-house equivalent, and tag it onto every downstream event: API key creation, first API call, and every call after that. Once attribution lives on the user record, you can filter any product funnel by creator and see exactly where that creator’s developers drop off, which is the point of doing this.
Handle dark social and self-reported attribution
A large share of developer traffic arrives with no referrer at all. Someone watches a video, doesn’t click the link in the moment, and instead searches your product name directly later, or pastes a link into a private Slack channel where the next click carries no UTM. This is dark social, and no tracking setup eliminates it. You can only estimate around it: add a short, optional “how did you hear about us” field at signup, compare direct-traffic spikes on your docs and landing pages during a campaign week against a pre-campaign baseline, and treat the difference as creator-influenced even when you can’t assign it to a specific UTM. Report this as influenced traffic, kept separate from directly attributed traffic, rather than folding it into either number.
The formulas: how to calculate DevTool influencer ROI
Once attribution is wired up, the math is straightforward. The formulas below divide campaign spend by the count at each funnel stage.
| Metric | Formula | What it tells you |
|---|---|---|
| Cost per qualified developer | Spend ÷ developers who visited docs and signed up | Efficiency of getting a technically engaged visitor into the product |
| Cost per signup | Spend ÷ signups | Baseline acquisition efficiency, before any product usage |
| Cost per activated developer | Spend ÷ activated developers | The number most worth defending in a pipeline review |
| Cost per first API call | Spend ÷ developers who made a first API call | The clearest signal of real technical intent |
| Customer acquisition cost (CAC) | Spend ÷ paying customers attributed to the campaign | Standard CAC, scoped to one campaign or creator |
| Creator-attributed revenue | Sum of revenue from accounts whose attribution traces to that creator | The top-line number finance will ask for |
For the headline number, use:
Influencer ROI = (Creator-attributed revenue − Campaign cost) ÷ Campaign cost × 100
This formula is correct and still incomplete on its own for an early-stage DevTool. A technical evaluation cycle of four to twelve weeks means revenue from a given campaign often lands after the reporting period closes, sometimes after the next quarter has already started. If you only report revenue ROI monthly, every recent campaign will look weak, not because it failed, but because its revenue hasn’t arrived yet. Use first API call rate, activation rate, and qualified signup rate as the monthly leading indicators, and calculate full revenue ROI on a trailing basis, quarterly, or against a 90-day cohort window, once enough of the evaluation cycle has played out.
Worked example: what a $5,000 creator campaign returns
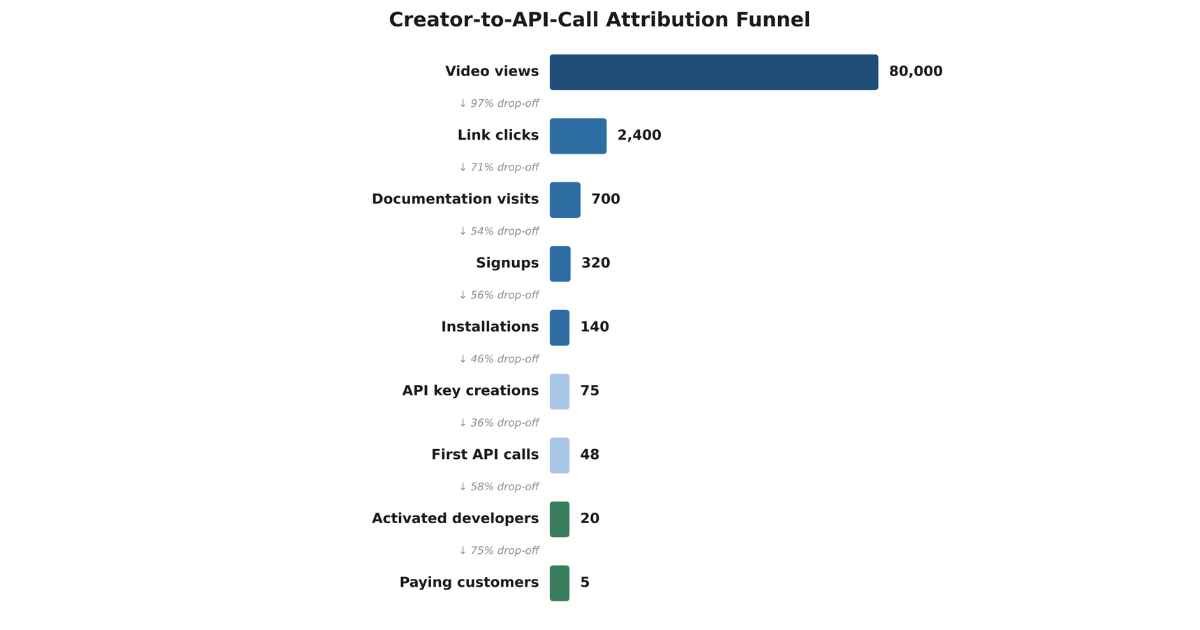
Here is a realistic, fictional run of these numbers. A DevTool spends $5,000 on a single creator campaign and tracks it end to end:
| Stage | Count | Drop-off from prior stage |
|---|---|---|
| Video views | 80,000 | — |
| Link clicks | 2,400 | 97% never click |
| Documentation visits | 700 | 71% of clickers never open the docs |
| Signups | 320 | 54% of docs visitors never sign up |
| Installations / SDK downloads | 140 | 56% of signups never install |
| API key creations | 75 | 46% of installs never create a key |
| First API calls | 48 | 36% of key holders never make a call |
| Activated developers | 20 | 58% of first-callers don’t return |
| Paying customers | 5 | 75% of activated developers don’t convert |
Assume an average first-year contract value of $1,200 for this product. Creator-attributed revenue is 5 × $1,200, or $6,000. Plugging that into the formulas above:
| Metric | Calculation | Result |
|---|---|---|
| Cost per signup | $5,000 ÷ 320 | $15.63 |
| Cost per first API call | $5,000 ÷ 48 | $104.17 |
| Cost per activated developer | $5,000 ÷ 20 | $250.00 |
| CAC | $5,000 ÷ 5 | $1,000.00 |
| Influencer ROI | ($6,000 − $5,000) ÷ $5,000 × 100 | 20% |
Reported on views alone, this campaign cost 6.25 cents per view and looks excellent. Reported on signups, $15.63 per signup looks reasonable for most DevTool budgets. Neither number shows where the campaign actually struggled. The drop-off column does: more than half of signups never installed anything, and more than half of API key holders came back only once and never returned. Those two percentages point at two different, fixable problems, a signup flow that doesn’t lead into installation, and an onboarding experience that doesn’t bring people back, and neither is visible if the report stops at 320 signups for $5,000.
Why 48 first API calls beat 80,000 views
A view is a proxy for exposure. A first API call is proof that a developer wrote code against your product and ran it. That distinction is the center of this whole framework, and it’s worth stating plainly: the first API call is the smallest unit of behavior that cannot happen by accident. Nobody writes an API request by habit, or because a video autoplayed, or because a thumbnail caught their eye. They write it because they decided, even briefly, that your product was worth ten minutes of their time.
That’s also why first-call rate correlates with eventual revenue far more tightly than any top of funnel number does. In the worked example above, the 48 developers who made a first call are a vanishingly small fraction of the 80,000 who watched, 0.06 percent. But that 0.06 percent is where every one of the five paying customers came from. Views predict nothing about who those five would be. First API calls narrow the field down to the people worth building a relationship with. A marketing team that reports views because the number is bigger is reporting the wrong thing on purpose, even if nobody frames it that way out loud.
Comparing creators on developer quality, not audience size
Audience size is a weak predictor of how many viewers are developers who will actually evaluate your product. A creator with 400,000 subscribers and a broad, generalist audience can produce fewer activated developers than a creator with 20,000 subscribers who specializes in exactly your category and demonstrates products hands-on rather than reading a script. Comparing creators on reach alone rewards the wrong behavior and makes the bigger, more expensive name look like the safer bet when it may not be.
Instead, compare creators on developer yield: activated developers per thousand views, or per dollar spent, calculated from the same attribution data built out above. This puts a 20,000-subscriber specialist and a 400,000-subscriber generalist on the same scale regardless of audience size. A few signals tend to predict which creators will score well on this before a full campaign of data exists: whether the creator built something with your product on camera, rather than reading from a sponsored script, whether their comment sections contain specific technical questions rather than generic praise, and whether their past sponsored content for other tools generated discussion on Reddit, Hacker News, or dev.to, places developers go to validate a recommendation before acting on it.
A creator comparison worth keeping in your tracking sheet looks at audience size, qualified traffic, activation rate, API calls generated, 30-day retention, and revenue, side by side, for every creator you’ve run. Over two or three campaigns, this table becomes the single best tool for deciding who to rebook and who to drop, and it’s usually not sorted the way your initial shortlist was.
Sourcing and vetting creators at this level takes more time than most in-house teams have budgeted for a single campaign, which is where a B2B influencer marketing agency for DevTools earns its fee: screening for the signals above before a dollar of spend goes out the door.
Measuring delayed conversions in a longer evaluation cycle
DevTool evaluation cycles run longer than most attribution windows assume. A developer might watch a video, bookmark it, close the tab, and come back three weeks later by searching your product name directly, a classic dark-social pattern. If your attribution window is set to the industry-default 30 days and your real evaluation cycle runs 60 to 90, you will systematically under-credit the campaigns that are actually working.
Three adjustments fix most of this. First, store first-touch attribution permanently on the account at signup rather than relying on last-click, session-based tracking that resets every time someone returns through a different path. Second, extend the attribution lookback window in your product analytics to match your real sales cycle, not a platform default, which usually means 90 to 180 days for a technical product rather than 30. Third, run a quarterly trailing sweep that re-attributes any new revenue back to the original campaign cohort, so a signup from March that converts to paid in June still shows up against the March campaign instead of landing in an unattributed bucket. None of this requires expensive software. It requires deciding, once, how long your evaluation cycle really is, and setting your tracking to match it instead of whatever a tool ships with by default.
Common attribution mistakes that distort the number
A handful of habits quietly wreck DevTool creator attribution, in both directions, sometimes making a weak campaign look strong and sometimes burying a strong one, and most of them line up with the eight failure modes behind underperforming B2B influencer campaigns.
Judging a campaign by last-click attribution alone erases the creator’s real influence whenever a developer returns later through direct or organic search, which is common given the evaluation cycles above. Using session-based UTMs that aren’t written to the user record at signup loses the trail the moment someone leaves and comes back on a different device. Comparing creators by raw view count instead of developer yield rewards reach over quality every time. Declaring a campaign a failure before the evaluation cycle has had time to play out confuses the absence of revenue so far with the absence of revenue still to come. Counting a landing page click as a qualified lead, with no product event behind it, inflates the top of the funnel and makes the real conversion rate from there look worse than it is. And treating every unattributed signup as pure organic growth, instead of estimating a creator-influenced dark-social share, systematically undercounts every creator campaign you run.
A monthly DevTool influencer ROI dashboard
A dashboard a marketing team can actually run every month needs three things: per-creator numbers, cumulative program numbers, and a decision for each creator. Structure it around the funnel built out earlier in this piece: for each active creator, track spend, qualified traffic, signups, first API calls, activated developers, and revenue to date, alongside the two leading-indicator rates that move faster than revenue, first-call rate and activation rate. Roll those up into a program-level view that shows total spend against total activated developers and total revenue for the trailing quarter, so the team has one number to defend in a budget conversation and a dozen more to explain it with.
The dashboard’s real job is turning data into a decision, not only a report. Every month, each creator should land in one of three buckets: rebook at current or higher spend, because first-call and activation rates are at or above the program average; renegotiate, because reach was fine but technical evaluation metrics lagged, which usually points at a mismatched audience rather than a bad creator; or pause, because the numbers haven’t moved after a full evaluation cycle has had time to play out.
Turning creator campaign data into a bigger developer marketing engine
Creator campaigns generate more than a ROI number. The drop-off points you find, a weak spot between docs and signup, a confusing path from install to API key, are a direct, prioritized list of what to fix in product and documentation, sourced from real behavior rather than a guess. A creator who demonstrates your SDK on camera has effectively written a public integration example; turning that into a linked repository extends its value well past the campaign window. The same video, and the comment threads underneath it, are also raw material for Reddit engagement and community discussion that keeps surfacing the campaign long after the spend is gone, and for the kind of specific, sourced content that AI search engines cite when a developer asks an LLM to compare tools in your category.
None of this replaces a dedicated developer marketing strategy. It does mean a single well-measured creator campaign can feed documentation, community, and search at once, instead of living and dying as a line item nobody looks at again after the invoice is paid.
Frequently asked questions
What counts as an activated developer for a DevTool?
There’s no universal definition, but a workable one is a developer who has made more than one API call across more than one session, not just a single test request. Set your own threshold based on what reaching real product value looks like for your tool, whether that’s a successful integration, a completed workflow, or a specific number of calls in the first week, and keep it consistent across campaigns so comparisons stay fair.
How long should I wait before judging a creator campaign’s ROI?
At least one full technical evaluation cycle, which for most DevTools runs four to twelve weeks. Judge leading indicators, first-call rate and activation rate, within the first two to four weeks, and hold full revenue ROI until a cohort has had its entire evaluation window to play out.
Do I need expensive attribution software to track this?
No. A UTM convention, a field on your signup form, a user property forwarded to whatever product analytics tool you already run, and a spreadsheet or lightweight dashboard on top of it covers most of this. The discipline matters more than the tooling.
Should I use first-touch or last-touch attribution for creator campaigns?
First-touch, stored permanently on the account at signup. Last-click systematically under-credits creators, because a meaningful share of developers research a tool after a video, then return later through a direct or organic path that last-click attribution would hand to the wrong channel.
How do I handle developers who find the product through a creator but sign up weeks later through organic search?
This is exactly what first-touch attribution and an extended lookback window are for. Pair it with a short “how did you hear about us” field at signup to catch the share of this traffic that arrives through dark social with no trackable link at all.
Is view count a useless metric?
Not useless, just insufficient on its own. View count is a reasonable proxy for reach and a factor in negotiating rates, but it should never be the metric a campaign is judged successful or unsuccessful by. Pair it with developer yield, activated developers per thousand views, to see whether that reach is technical in the first place.
How many creators should I test before judging the channel as a whole?
Three to five, at minimum, before concluding anything about influencer marketing as a channel for your product. Individual creator results vary widely even within the same niche, and judging the whole channel on one or two placements is really just judging those one or two creators.
Disclaimer: The information in this article is for general informational purposes only and does not constitute professional, legal, financial, or business advice. Marketing metrics, attribution methods, platform capabilities, and industry benchmarks vary by product, market, and tooling, and may change without notice. The worked example is fictional and illustrative only; actual campaign results will differ. Readers should verify all tracking setups, data practices, and privacy compliance requirements with qualified professionals before implementing any measurement framework. Any mention of specific platforms, tools, or agencies does not imply endorsement. The author and publisher disclaim any liability for decisions made based on this content.
Unlock a clearer understanding of the topics you care about—browse our well-researched guides and learn with confidence.